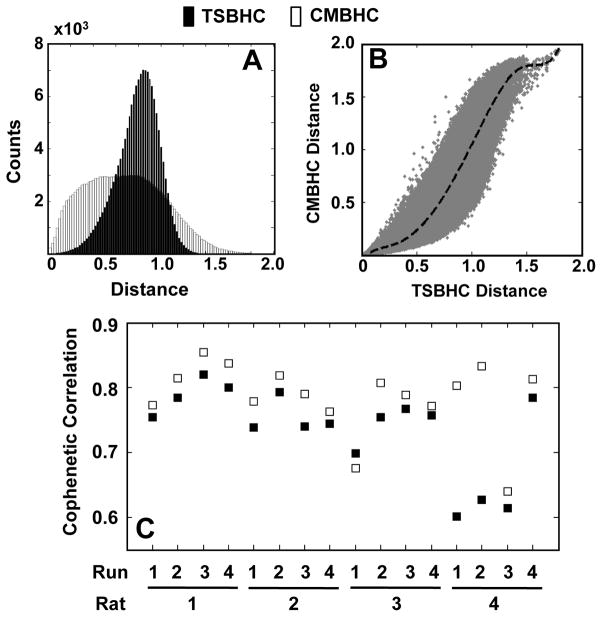
Figure 6.
Comparison between the time series based hierarchical clustering (TSBHC) and the correlation matrix based hierarchical clustering (CMBHC). Compared to the TSBHC (black), the distribution of original distances in the CMBHC (white) is more uniform (A), and the scatter plot suggests a nonlinear relationship between them (B). Moreover, a comparison on cophenetic correlations (from all runs) indicates a better goodness of fit (p = 0.007) with the CMBHC (C). Note: the (A) and (B) are based on the data from Run 1 of Rat 1; and the dash line in (B) represent the mean of CMBHC distances.

