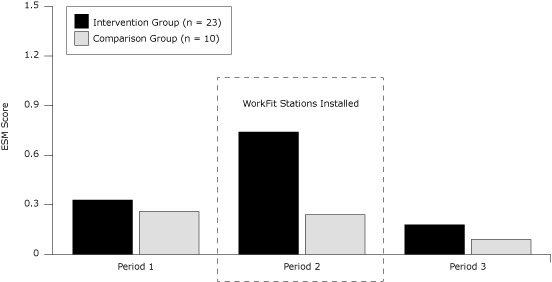
Figure 2. Average experience-sampling methodology (ESM) score by group and period of the study, the Take-a-Stand Project, Minneapolis, Minnesota, 2011. ESM score represents the average score by period generated by participants responding to the questions whether they were sitting (0), standing (1), or walking (2), respectively. Period 1 represents the baseline period (average across 1 week), Period 2 represents the intervention period (average across 4 weeks), and period 3 represents the postintervention period (average across 2 weeks).
| Period | Intervention Group (n = 23) | Comparison Group (n = 10) |
|---|---|---|
| Period 1 | 0.33 | 0.26 |
| Period 2 | 0.74 | 0.24 |
| Period 3 | 0.18 | 0.09 |

