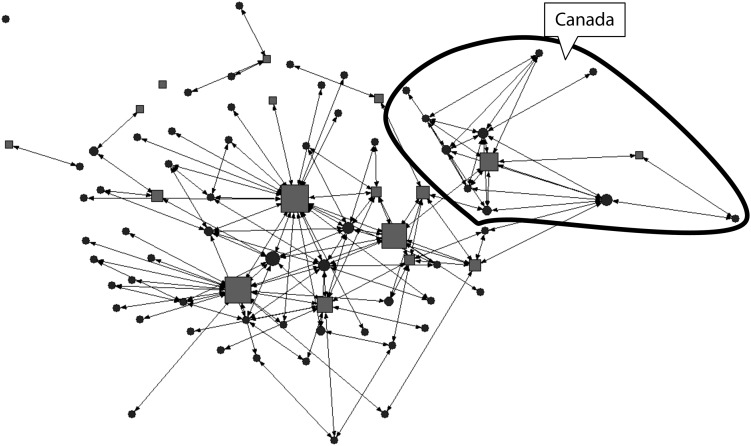
FIGURE 1—
Reciprocated information sharing ties across all quitline organizations (funders and providers are separate): Mapping Tobacco Quitlines in North America.
Note. Gray squares represent quitline providers, dark gray circles represent quitline funders, and size of the node is indicative of betweenness centrality (i.e., reflecting the number of organizations a particular organization is connected to, which are not themselves directly connected).

