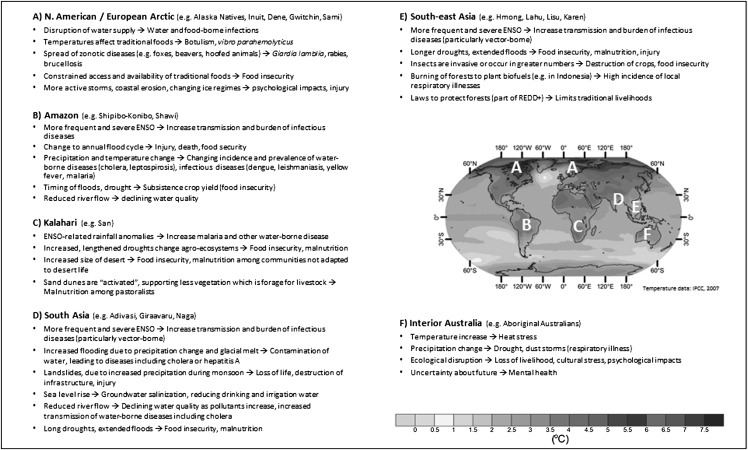
FIGURE 1—
Map of projected surface temperature increase for 2090 to 2099 based on the A1B scenarios with key health risks for indigenous populations noted.
Note. ENSO = El Niño-Southern Oscillation; IPCC = Intergovernmental Panel on Climate Change; REDD+ = reduce emissions from deforestation and forest degradation.
Source. Solomon et al.18

