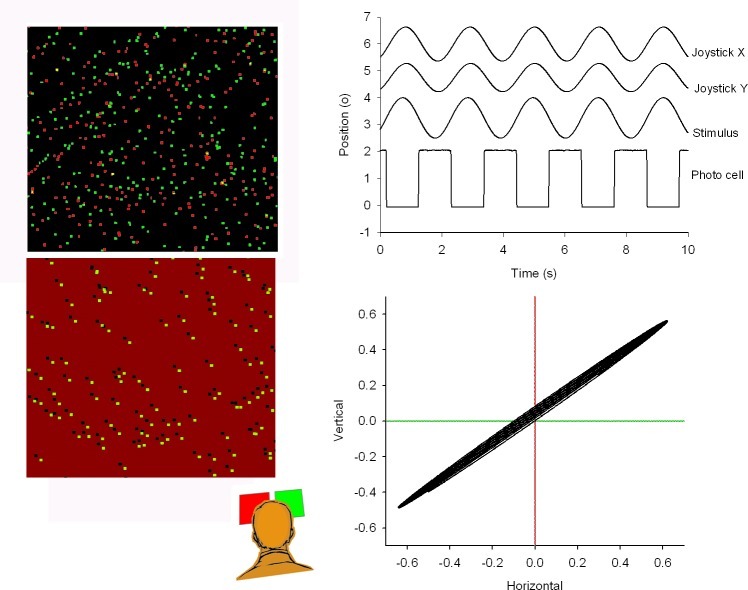
Figure 1. .
Left panel: cartoon of the correlated (upper panel) and anti-correlated (lower panel) stimulus displays from a subject's point of view. From behind the red and green filters, the left and right eyes saw the stimulus oscillating between up and down, and between left and right, respectively. Subjects tracked the perceived stimulus motion with a joystick. Amplitudes of the joystick signal were scaled to the actual stimulus amplitude. The upper right panel shows the perceived direction of motion of the pattern in relation to the stimulus motion. The signal labeled “stimulus” was reconstructed from the square wave photocell signal, in which each flank corresponds to a zero crossing of the sinusoidal motion. The lower right panel shows the perceived vectorial motion direction of the stimulus and the actual motion components.

