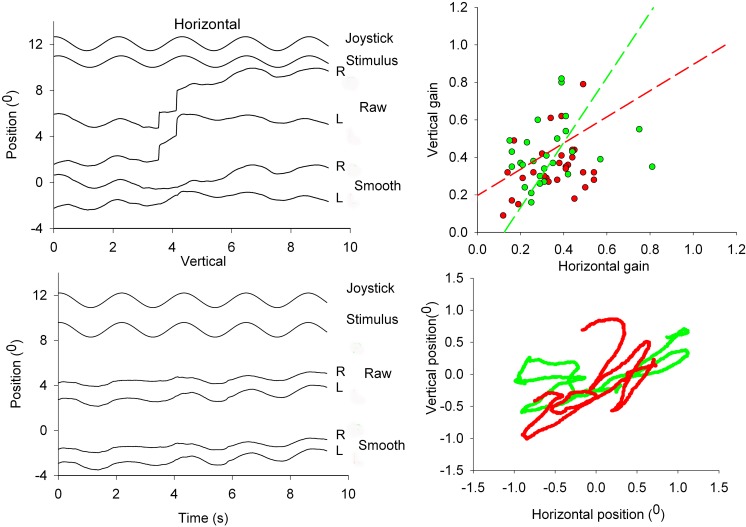
Figure 4. .
Eye movements in response to the orthogonally oscillating 200 dot anti-correlated stereogram. Left panels show horizontal (middle panel) and vertical (lower traces) raw and smooth eye movements. Top two traces at each of the two left panels show stimulus motion and perceived movement indicated with a joystick. The XY-plot at the lower right panel shows an example of the horizontal and vertical excursions of the smooth components of the two eyes. Top right panel shows a scatter plot of the horizontal versus vertical gain of left (closed circles) and right (open circles) eyes of all six subjects. Data points are fitted with an orthogonal fit procedure, minimizing errors in X and Y direction.

