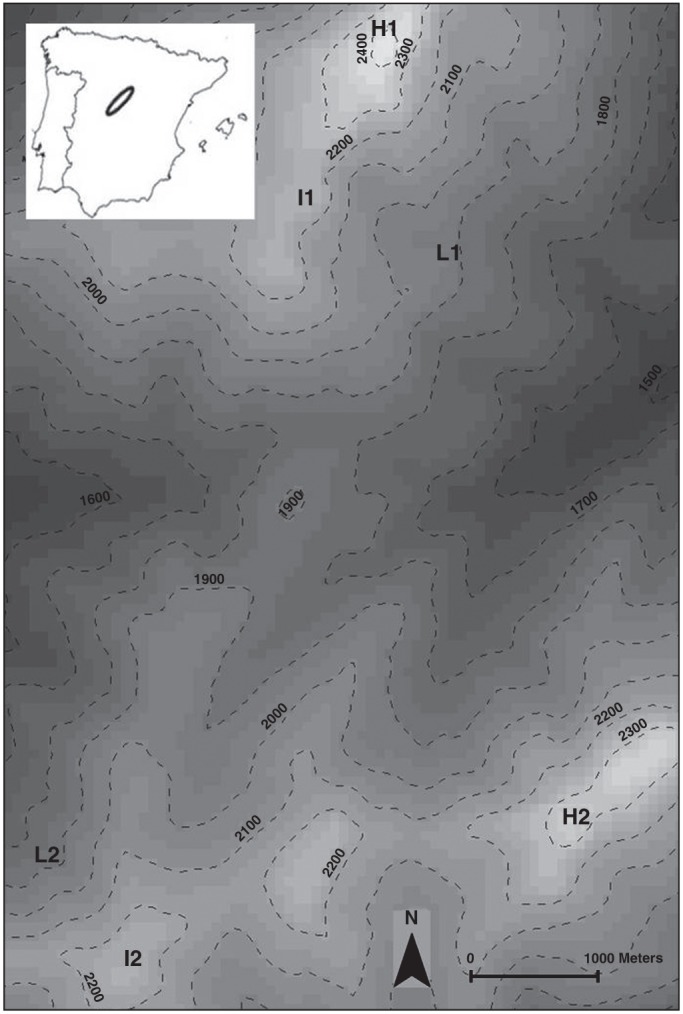
Fig. 2.

Location of the populations in the study zone. ‘High’ (H1 and H2), ‘Intermediate’ (I1 and I2) and ‘Low’ (L1 and L2) populations distributed over two mountains (1, Peñalara; 2, Cabeza de Hierro). Discontinuous lines represent 100-m contour intervals.
