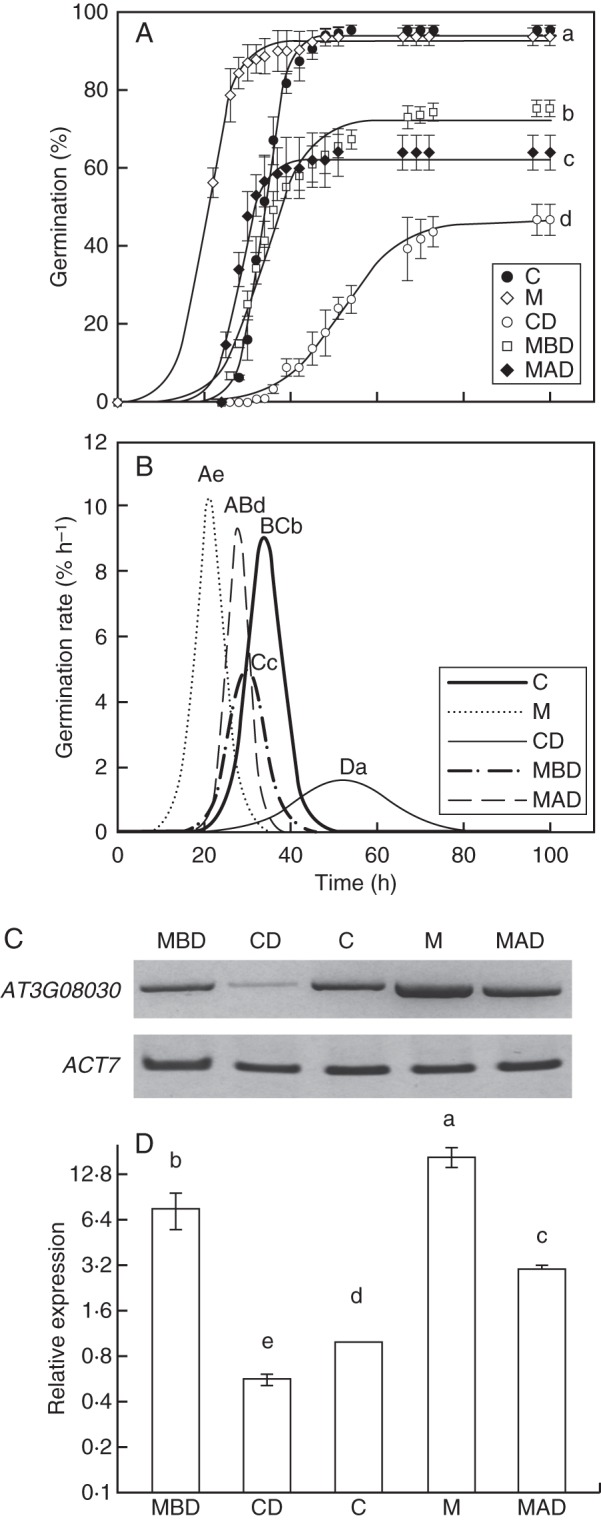
Fig. 3.

Germination curves and At3g08030 expression: control seeds (C), matrix primed control seeds (M), controlled deteriorated seeds (CD), matrix priming treatment before controlled deterioration treatment seeds (MBD) and matrix priming treatment after controlled deterioration treatment seeds (MAD). (A) Cumulative germination curves. Letters indicate statistical differences between the germination curves. (B) Maximal germination rate. Upper-case letters indicate statistical differences between germination rate and lower-case letters indicate statistical differences between mean germination time. (C) RT-PCR analysis was performed using dry or treated seeds. ACT7 expression was used as an internal control. (D) Relative expression levels of At3g08030 were determined in seeds with different vigour by qRT-PCR using At3g08030-specific primers (Table 1). First-strand cDNA was synthesized and used as template for qRT-PCR amplification as described in the Materials and Methods. Expression levels were normalized against ACT7 values. Note logarithmic scale. Values represent the mean and s.d. of results from duplicate experiments. Letters indicate statistical differences between the germination curves.
