
Figure 2. Association of parent perceptions of neighborhood physical/social order and health (n=319).
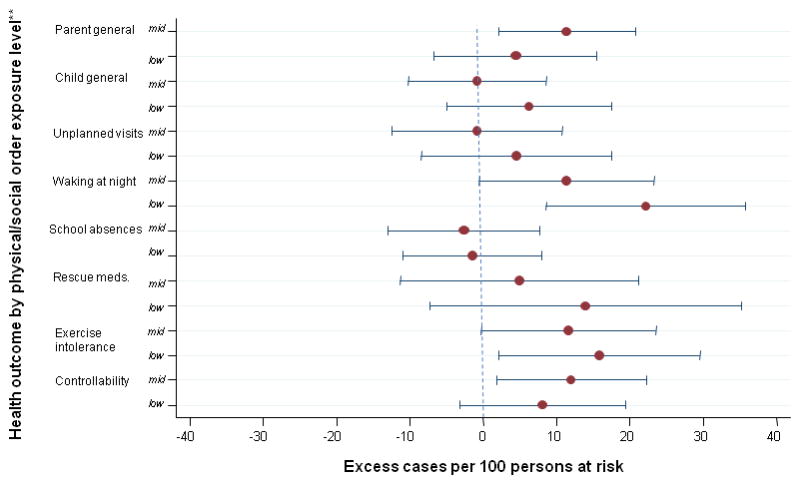
*Adjusted for parent race, age, education, marital status, and/or nativity
**Each RD contrasts the middle (mid) or the low exposure level with the high level