
Figure 4.
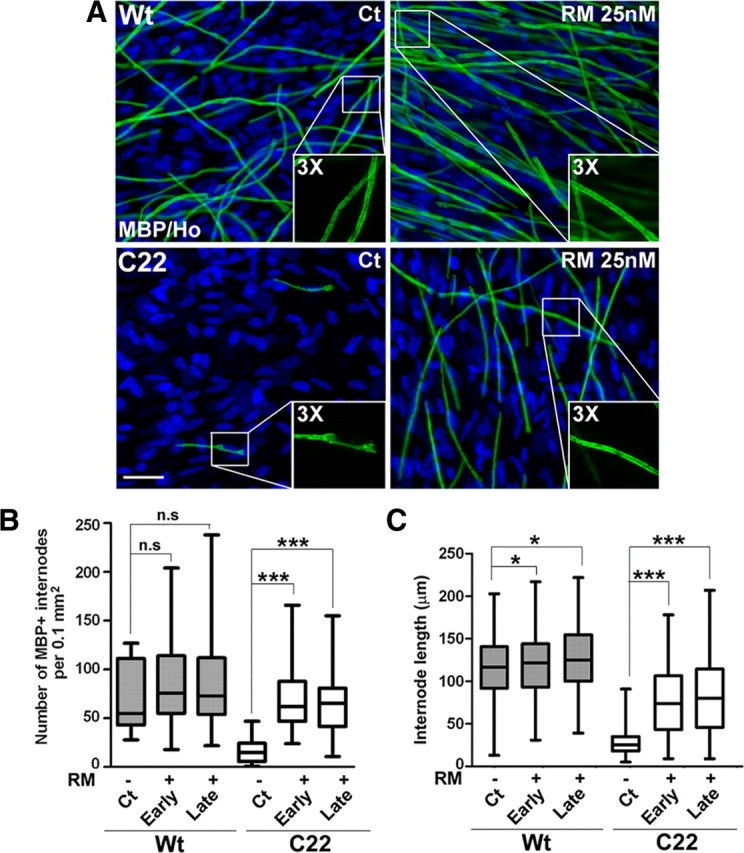
The abundance and length of myelin internodes are increased by rapamycin. A, Explant cultures from Wt and C22 mice were treated with Ct or RM at late stage, as described in Figure 3A, and stained for MBP (green) to visualize myelin. Scale bar, 40 μm. Hoechst dye stains the nuclei (blue). B, The abundance of myelin internodes was quantified in a fixed area [p > 0.2, not significant (n.s); ***p < 0.001, t test, mean ± SEM, n = 3). C, The lengths of the myelin internodes (n = 130–260) were measured and quantified in three independent experiments (*p < 0.05, **p < 0.01, ***p < 0.001, t test, mean ± SEM).