Figure 5.
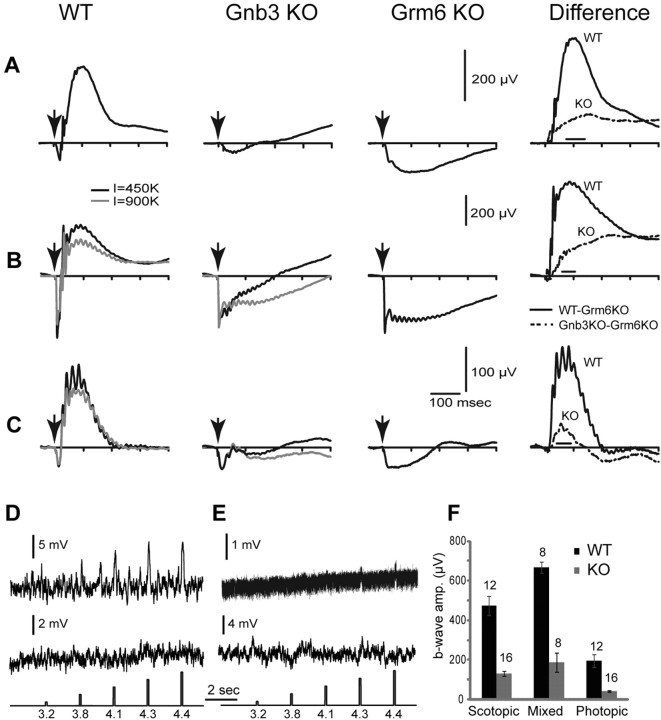
Light responses in Gnb3-null ON bipolar cells are dramatically reduced, but not eliminated. A–C, Averaged ERGs of WT, Gnb3-null (KO), and Grm6-null (KO) mice under three different conditions. Arrows indicate a stimulus flash. In A, animals were dark adapted overnight and stimulated with a flash that produced 10 photoisomerizations per rod, which is below cone threshold. These represent scotopic conditions. The right panel represents the average Grm6 KO record subtracted from the average WT (solid lines) or Gnb3-KO record (dotted lines). This difference between the original ERG record and the Grm6 KO record is an estimate of the pure b-wave in these two mouse lines. In B, animals were dark adapted and stimulated with a saturated light flash of 450,000 (black traces) or 900,000 (gray) R* per rod. This flash stimulates both rods and cones, so the ERG represents the mixed rod- and cone-driven responses. Subtracted records on the right are for the lower intensity (black). In C, mice were adapted to a bright background (513 nm; 27,000 R*/rod/s) that completely suppressed the cGMP-activated current of the rods. They were then stimulated with an intense white flash that isomerizes 1% of the M-cone pigment and 0.1% of the UV-cone pigment in adult mice. ERG traces represent cone-driven responses, i.e., photopic conditions. For the mixed and photopic responses (B, C), only the records for 450,000 R* per rod were used for subtraction (because the Grm6-KO was stimulated only with this intensity). The number of records averaged for Grm6-null mice was eight for scotopic and mixed conditions and six for photopic conditions. D, E, Whole-cell recordings from wild-type (D) and Gnb3-KO (E) rod bipolar cells under current-clamp mode. Two examples are given for each genotype; the top one shows a light response and the bottom does not. The response of the Gnb3-KO cell in the top trace is very small, but clearly above the noise. Interestingly, the noise level in this cell was much lower than the rest (same recording procedures). Perhaps this is the reason the response can be extracted. The lowest traces show the timing and intensity of the light stimuli; these are given in log photons μm−2 per flash. F, A histogram quantifying the average b-wave amplitude for wild-type and Gnb3-null eyes under the three recording conditions. The time windows used to average these values for each condition are indicated by the horizontal line just above the x-axis in the difference ERGs of A–C. Numbers above the histogram bars indicate the numbers of averaged records. For this and subsequent figures, error bars indicate SEs.

