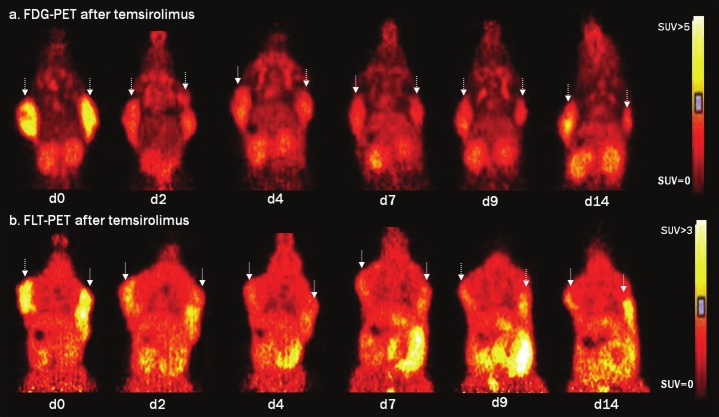
Figure 3.
Serial FDG-PET (a) and FLT-PET (b) images acquired on d0, d2, d4, d7, d9 and d14 following temsirolimus treatment. Images are scaled to the same SUV scale ranging from 0-5 for FDG-PET and from 0-3 for FLT-PET. Matching coronal views are depicted to demonstrate the FDG uptake (a) and FLT uptake (b) in the tumors on both shoulders (indicated with arrow).

