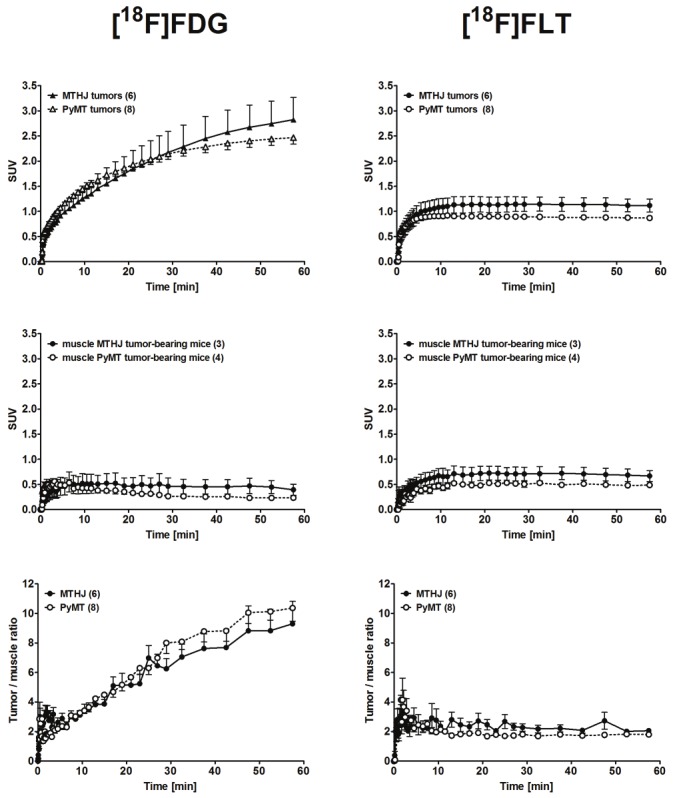
Figure 6.

Time-activity curves (TAC) of the radioactivity profile in MTHJ- and primary PyMT cell-derived tumor bearing FVB mice. TACs are shown for the tumors (upper panels), muscle tissue (analyzed from the opposite shoulder region) of the same FVB mice (middle panels), and tumor/muscle ratios (lower panels) after single intravenous injections of [18F]FDG (left) or [18F]FLT (right). Data are shown as means ± S.E.M. from 6 MTHJ tumors in 3 tumor-bearing mice and for 8 primary PyMT cell-derived tumors in 4 tumor-bearing mice.
