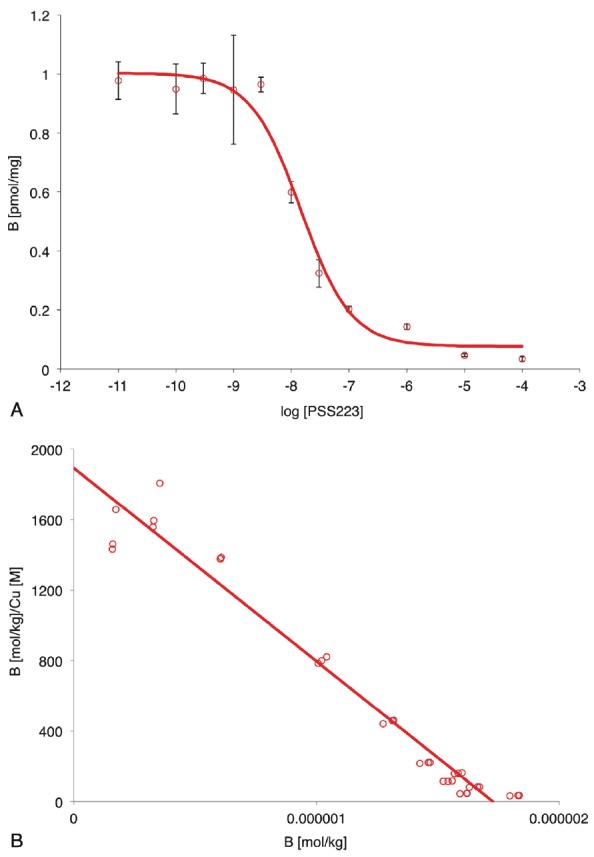
Figure 3.

A. Displacement of [3H]-ABP688 by PSS223. [3H]-ABP688 (total 2 nM) binding (B) as a function of the PSS223 concentration. Symbols represent mean±SD of one experiment performed in triplicate. Non-linear fitting (red line) resulted in IC50 14 nM and corresponding Ki 6 nM; B. Scatchard plot analysis of the specific binding of [18F]-PSS223 to rat brain membranes. Symbols, specific binding (total binding minus binding in the presence of 100 μM MMPEP) of one representative experiment; red line, linear regression.
