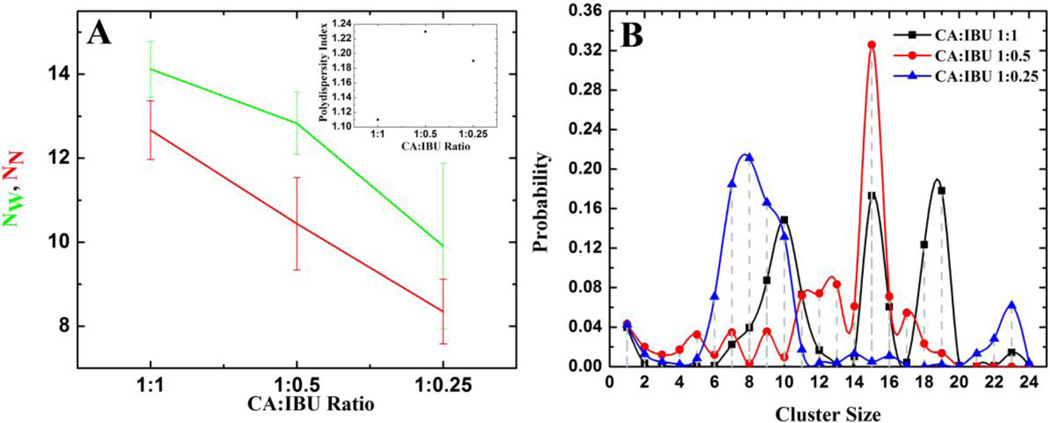
Figure 2.
(A) Ensemble averaged NW and NN (main plot) and polydispersity index (inset). (B) Weighted probability distribution of the total number of CA and IBU molecules belonging to clusters of size CSn where CSn is defined as the number of CA-IBU mixed micelles of size n (n=2, 3, 4…) or the number of CA and IBU monomers (n=1). For this and subsequent figures the first 30ns of the trajectories was excluded.

