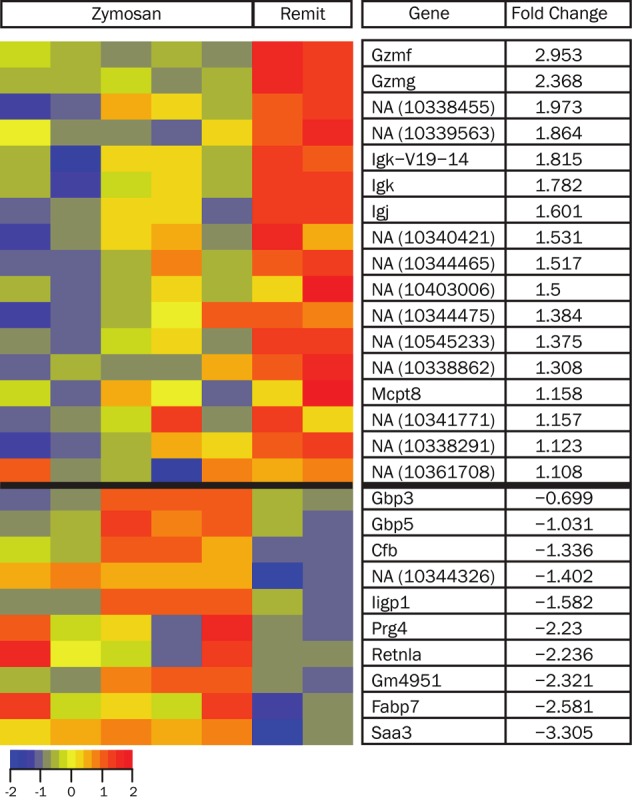
Figure 2.

Heat map of differentially expressed genes in the PBMCs of zymosan-treated (SKG+Z) compared with pregnant remitted mice (SKG+Z+P(R)). The normalized log intensity values for the 27 differentially expressed probe sets were centered to the median value of each probe set and colored on a range of -2.0 to +2.0. Red denotes up-regulated expression levels and blue denotes down-regulated expression levels as compared to the median value. Columns contain data from a single mouse PBMC sample, and rows correspond to a single probe ID. Rows are ranked by fold change of mean of SKG+Z+P(R) compared to mean of SKG+Z.
