Figure 3.
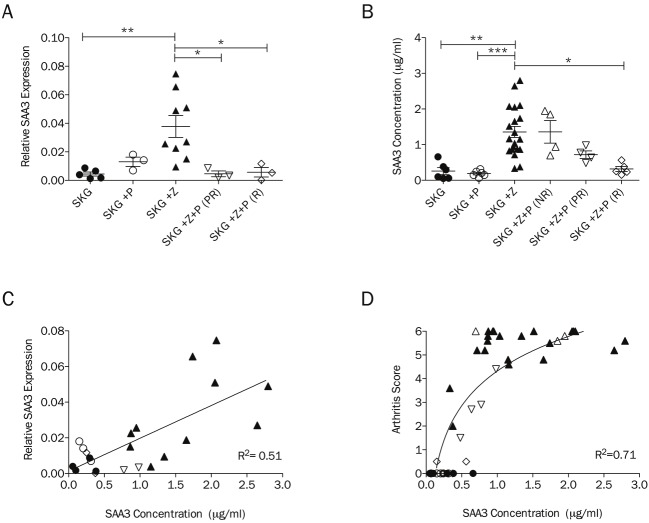
SAA3 is a biomarker of inflammatory arthritis remission in SKG mice. A, Relative RNA expression of SAA3 in PBMCs as determined by qRT-PCR in untreated SKG mice (SKG, n= 5; circle), pregnancy only (SKG+P, n=3; open circle), zymosan-treated (SKG+Z, n=9; triangle pointed up), zymosan-treated pregnant partially-remitted (SKG+Z+P (PR), n=3; open triangle pointed down) and zymosan-treated pregnant remitted (SKG+Z+P(R), n=3; open diamond) on E14.5. B, SAA3 plasma concentrations as determined by ELISA in untreated SKG mice (SKG, n= 6; circle), pregnancy only (SKG+P, n=6; open circle), zymosan-treated (SKG+Z, n=20; triangle pointed up), zymosan-treated pregnant nonremitted (SKG+Z+P(NR), n=4; open triangle pointed up), zymosan-treated pregnant partially-remitted (SKG+Z+P(PR), n=4; open triangle pointed down) and zymosan-treated pregnant remitted (SKG+Z+P(R), n=5; open diamond) on E14.5. C, Correlation of relative RNA expression of SAA3 in PBMCs and concentrations of SAA3 in plasma. D, Correlation of arthritis score and plasma concentration of SAA3. Symbols in panels C and D correspond with groups defined in panels A and B. (*p<0.05, **p<0.01, ***p<0.001).

