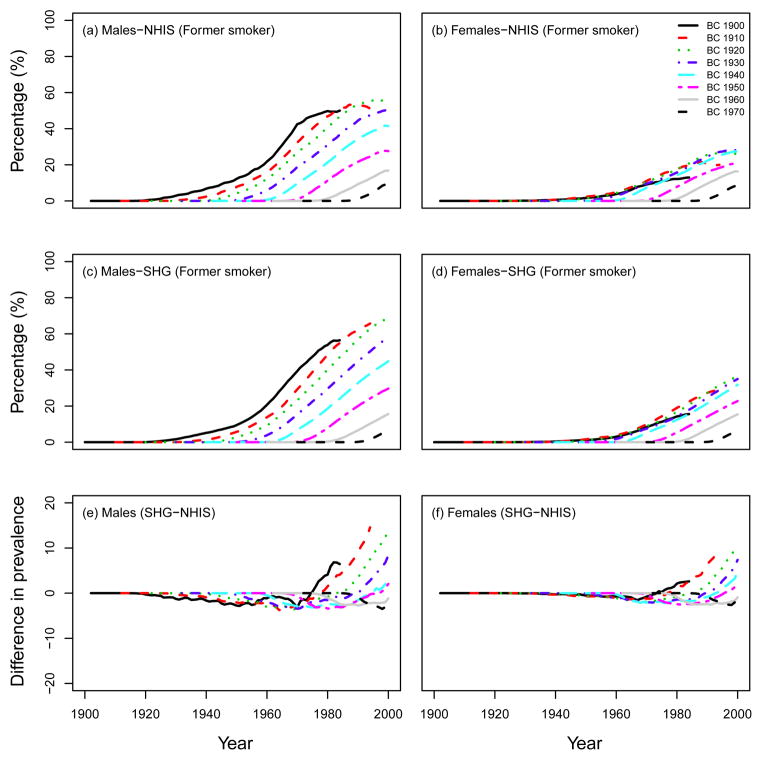
Fig. 5.
Percentage of former smokers in US males and females. Top row: observed data from the NHIS survey, middle row: computed prevalence using the SHG-generated data, adjusted for lung cancer deaths (ATC scenario). Bottom row: Difference between SHG-generated prevalence (SHG) and observed prevalence (NHIS), calculated by SHG-NHIS. BC=birth cohort.

