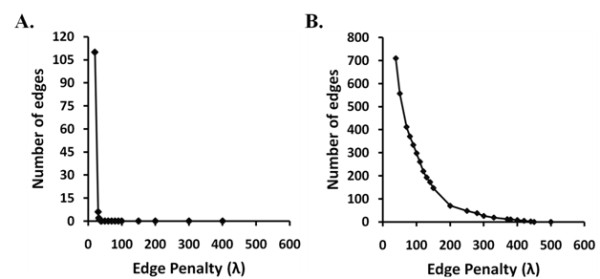
Figure 7.

Model Complexity Curve. This figure shows a plot of the number of edges learned by the MRF as a function of the model complexity parameter, λ (A) on the permuted GPCR MSA (Null model) and (B) on the GPCR MSA. This exercise was carried out to define ‘robust’ edges or edges which are selected at a zero false positive rate. The penalty for which the number of edges goes to zero is λ = 38 for the permuted GPCR MSA and this is used as the parameter for defining ‘robust’ edges. The number of edges goes to zero at around λ = 450 for GPCR MSA. The smaller the parameter the denser the model and larger the parameter the sparser the model.
