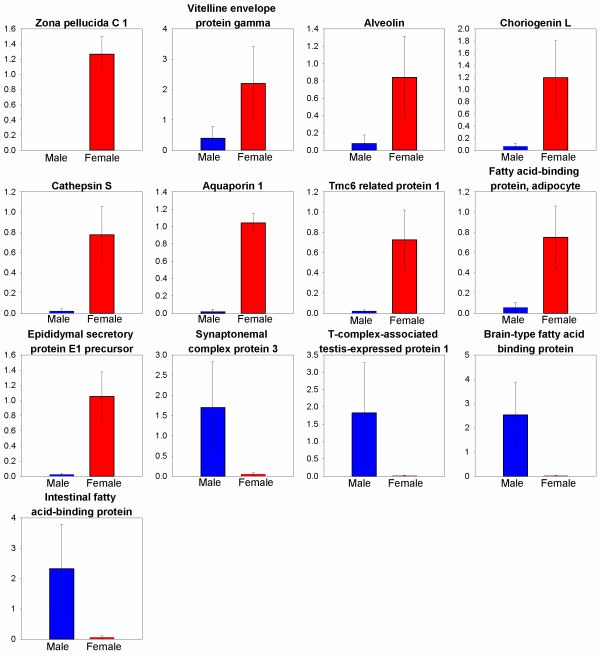
Figure 3.
Mean relative EST abundance between T. thynnus male and female gonad tissues as determined by QPCR analysis. All ESTs graphed are significantly different (p<0.05) with error bars representing standard deviation. Putative EST sequence annotation identities are as follows: Zona pellucida C 1 – TTC00305; Vitelline envelope protein gamma –TTC00056; Alveolin – TTC00935; Choriogenin L – TTC04136; Cathepsin S – TTC00230; Aquaporin 1 – TTC00180; Tmc6 related protein 1 – TTC04625; Fatty acid-binding protein, adipocyte – TTC00964; Epididymal secretory protein E1 precursor – TTC00209; Synaptonemal complex protein 3 – TTC02745; T-complex-associated testis-expressed protein 1 – TTC02749; Brain-type fatty acid binding protein – TTC05153; Intestinal fatty acid-binding protein – TTC05128. Refer to table 1 for accession numbers associated with these ESTs and putative annotations. The colors blue and red refer to male and female gonad tissues respectively. The Y axis represents relative abundance of transcripts between male and female gonads.

