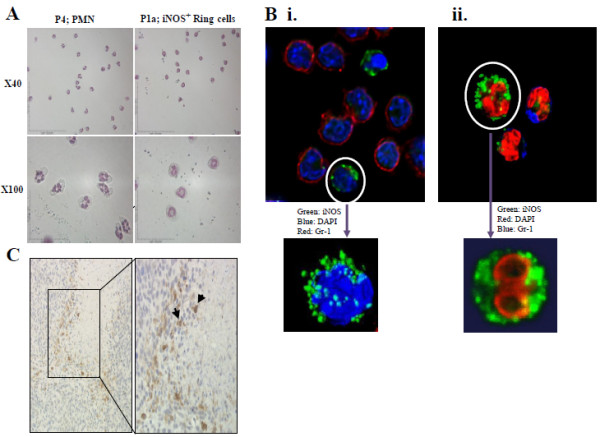
Figure 3.

Morphology and immunohistochemistry analysis of iNOS+cells.A. Tumor-purified iNOS+ (P1a) and iNOS- (P4 = PMN) fractions were first evaluated by cytospin followed by Wright-Giemsa staining. Pictures are shown in two different magnifications (x40 and x100). Data are representative of at least two experiments. B.Bi: Confocal microscopy optical section of a mixture of PMN and iNOS+ ring cells, with red representing Gr-1, green iNOS and blue nuclear (DAPI) staining. Inset: 3D volume rendering of an iNOS+ cell demonstrating iNOS-positive vesicles surrounding the nucleus. Bii: 3D volume rendering derived from a stack of confocal optical sections with green representing iNOS staining, red as DAPI and blue as Gr-1 staining. Inset: 3D volume rendering of a single iNOS+ cell showing the torus shaped nucleus as seen after using clipping planes to "remove" half of the volume along the z-axis. The nucleus in this cell is orientated at right angles to those seen in A (x100). C. Histological analysis of a section from a primary tumor. The necrotic areas could be differentiated by debris. The results are representative of two independent experiments.
