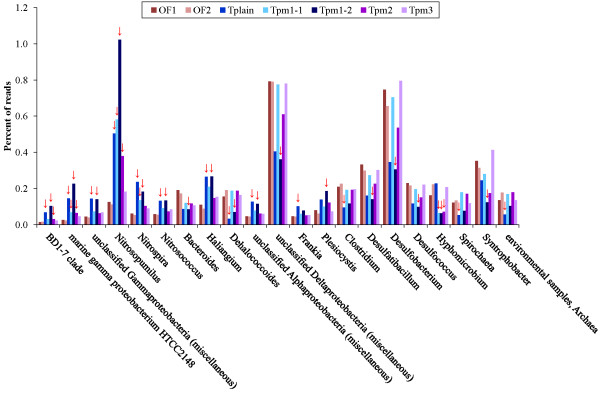
Figure 4.
Significant differences in prokaryote taxonomy between Troll and Oslofjord metagenomes. The figure shows abundant taxa at the genus level (≥ 0.1 % of the reads in one or more metagenomes) that were classified as significantly different in at least one Troll metagenome compared to both Oslofjord metagenomes in the STAMP analysis. Troll metagenomes significantly different from the Oslofjord metagenomes are marked by red arrows.

