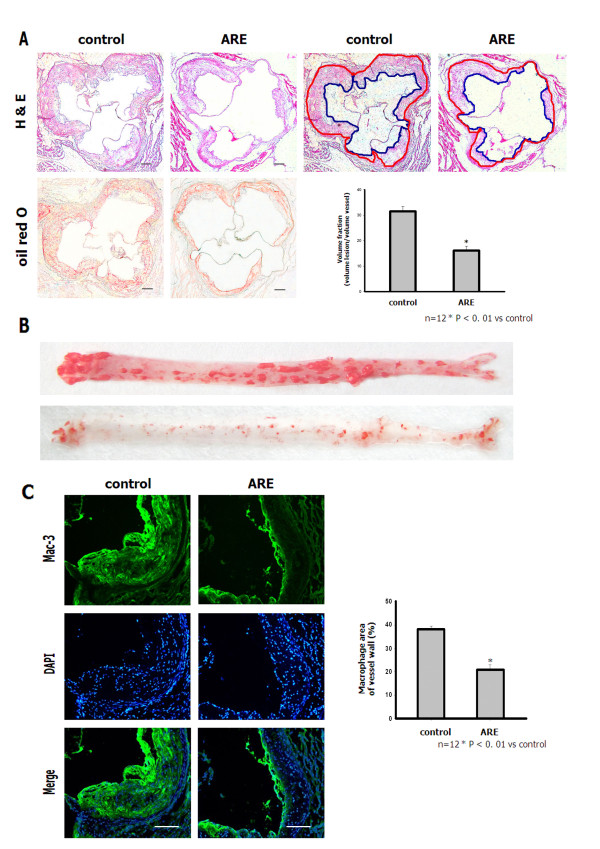
Figure 4.
ARE inhibited progression of established atherosclerotic lesions and accumulation of macrophages in the aorta of apoE−/−mice. A. Hematoxylin and eosin and oil red O staining of lesions in the aortic root in control and ARE apoE−/− mice (100×). Scale bars: 80 μm. B. Representative oil red O-stained aortas from apoE−/− mice in both groups. Bar graph shows distribution of intima/lumen ratio. *P < 0.01 vs control. C. Atherosclerotic lesions in aortic root from control and ARE apoE−/− mice immunostained with anti-mouse macrophage antibody (Mac-3). Double-immunofluorescence staining (n = 4–5 sections per tissue, at least three sites of analysis per slide). Bar graph shows quantitative comparison of composition of atherosclerotic lesions between control and ARE-treated groups. Scale bars: 80 μm.

