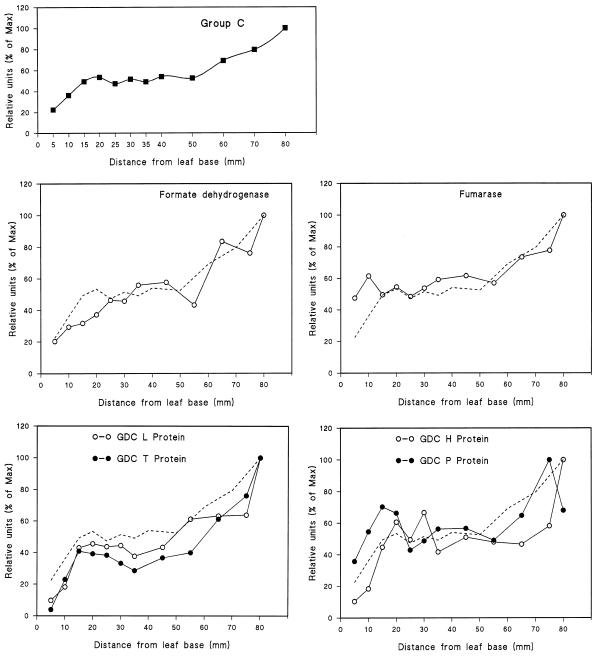
Figure 4.
Mitochondrial proteins of group C, with maximum intensity of signal occurring at the leaf tip. The data were calculated from the mean values of each of the mitochondrial proteins categorized as group C. The group C mean is also represented by a dashed line in each of the individual protein profiles.

