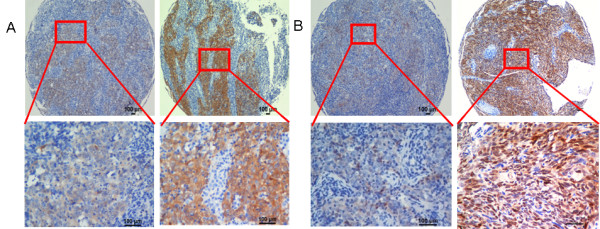
Figure 1.

Different expression patterns of Hsp70 in NPC tumor tissues.A, Low and high expression levels of Hsp70 in the membrane and cytoplasm in the TMA are shown under both low and high magnification. B, Low and high levels of Hsp70 nuclear abundance in the TMA are shown under both low and high magnification. Scale bars, 100 μm.
