
Figure 2.
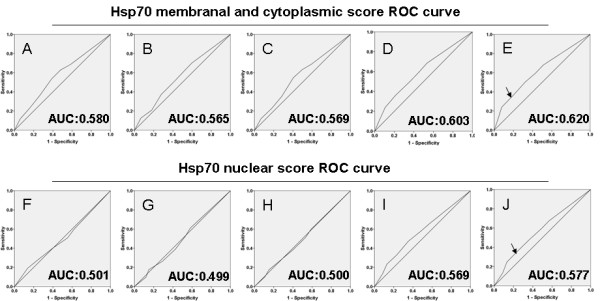
Selection of the cutoff scores. Receiver operating characteristic curve analysis was employed to determine the cutoff score for the designation of “high expression” of Hsp70 with membranal, cytoplasmic or nuclear staining. The sensitivity and specificity for each outcome of Hsp70 membranal and cytoplasmic staining were plotted: ( A) T classification ( P =0.002); ( B) N classification ( P =0.029); ( C) Clinical stage ( P =0.029); ( D) Cancer progression ( P <0.001); ( E) Survival status ( P <0.001). The sensitivity and specificity for each outcome of Hsp70 nuclear staining were plotted: ( F) T classification ( P =0.964); ( G) N classification ( P =0.97); ( H) Clinical stage ( P =0.99); (I) Cancer progression ( P =0.009); (J) Survival status ( P =0.005).