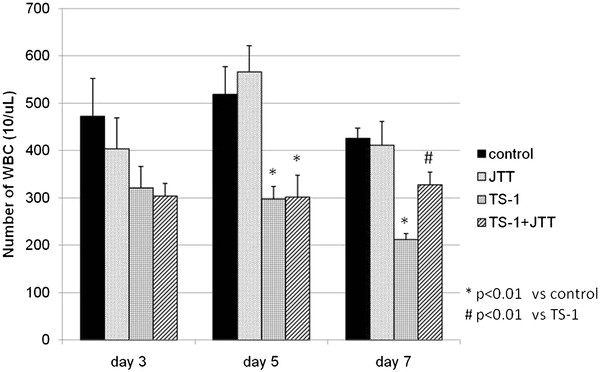
Figure 2.
Comparison of white blood cell count. Comparison of white blood cell (WBC) count in treated mice on days 3, 5 and 7. Control, treated with 0.5% HPMC and DW; JTT, treated with 0.5% HPMC and 1 g/kg of JTT; TS-1, treated with 10 mg/kg of TS-1 and DW; TS-1 + JTT, treated with 10 mg/kg of TS-1 and 1 g/kg of JTT. Data represent means ± SE.

