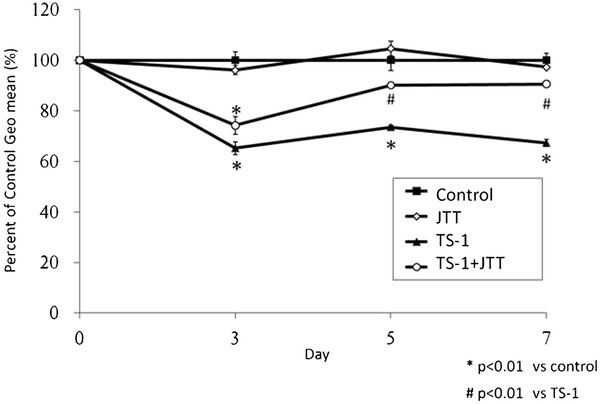
Figure 3.

Comparison of bone marrow cell by geometric mean fluorescence intensity. BMCs were labeled with anti-CD34 antibody conjugated with FITC. Fluorescent intensities of labeled cells were gated in high forward. Geometric mean of fluorescent intesnsities were calculated and represented as the ratio to the Control values. Data represent means ± SE.
