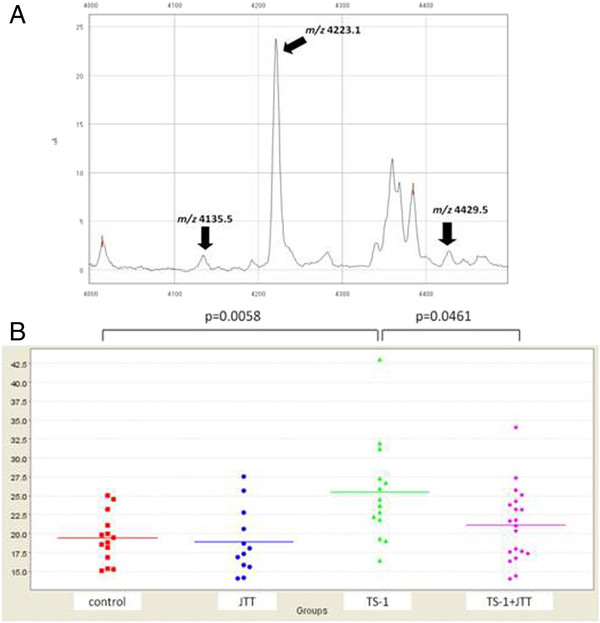
Figure 4.

Detection of biomarker candidates. A) Spectrum of the peaks of three biomarker candidates (arrows). The protein peaks were detected on a CM10 chip. B) Representative SELDI analysis data of the m/z 4223.1 peak as a biomarker candidate. In each group, plots indicate the intensity of the peak and bars represent the mean value.
