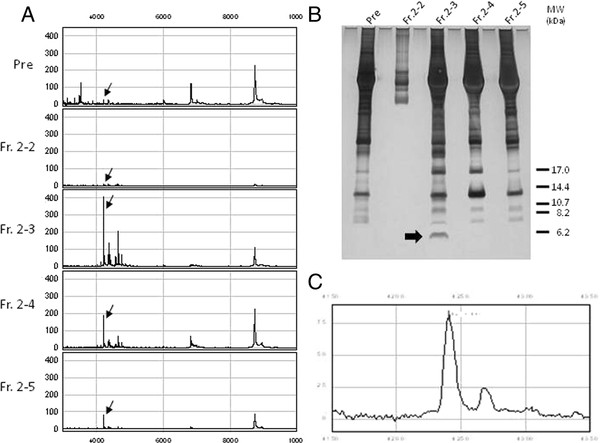
Figure 5.

Purification of a biomarker candidate. Purification of the biomarker candidate peak at m/z 4223.1 involved using a combination of spin column and SDS-PAGE. A) Spectra of peak fractions eluted from the cation exchange spin column; before fractionation plasma, Fr. 2–2, Fr. 2–3, Fr. 2–4 and Fr. 2–5. The peaks were detected on a CM10 chip. The candidate peak is marked by an arrow. B) Each fraction was separated by SDS-PAGE and protein bands were visualized by silver staining. C) The band marked by an arrow in the Fr.2-3 lane was extracted from the gel and then analyzed by SELDI TOF-MS.
