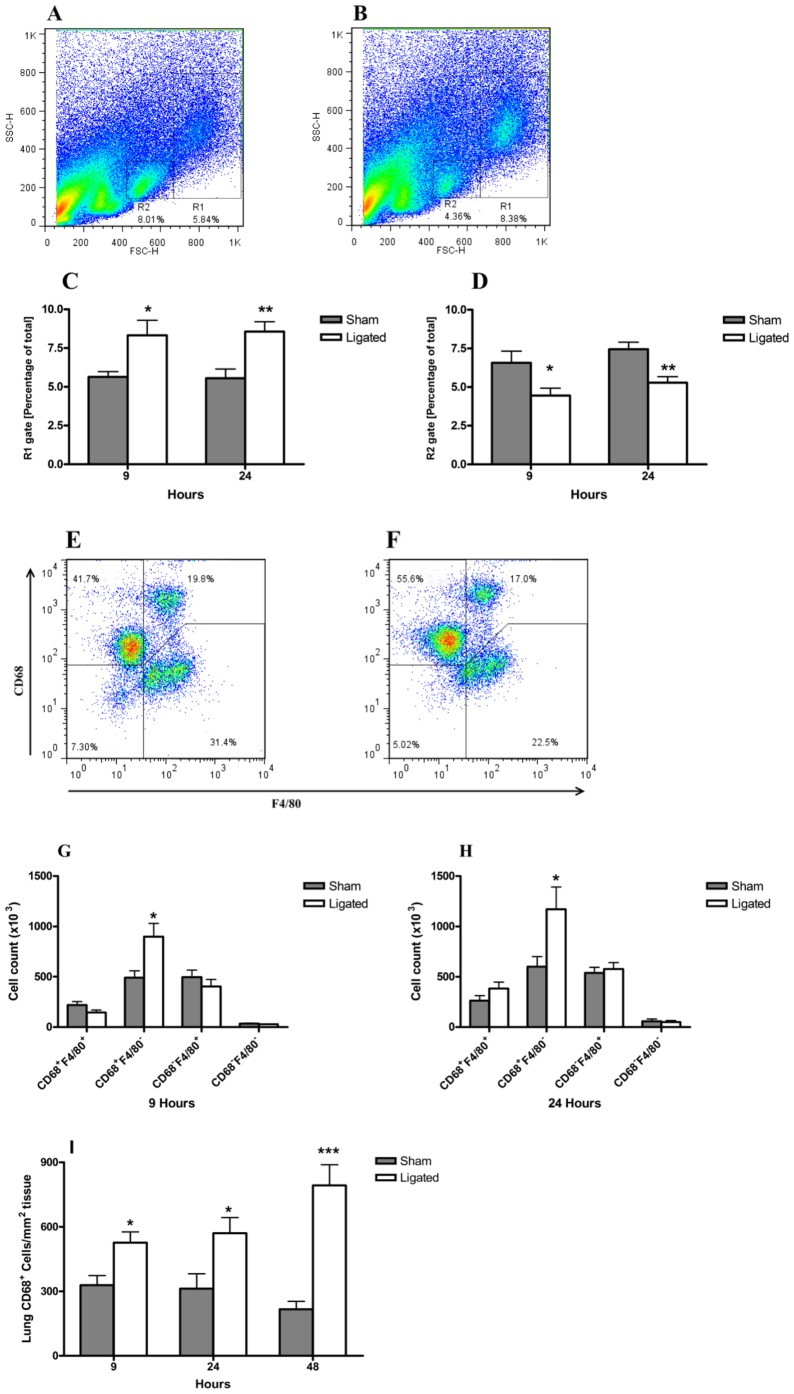
Figure 6. Changes in lung macrophage sub-populations during acute pancreatitis.
Single cell preparations of the right lung were evaluated by flow cytometry. Dot plots from one representative experiment of sham control (A) and 24 h post pancreatitis induction (B) showing the gating strategy. Significant modulations in the percentage of R1 (C) and R2 (D) gated populations following acute pancreatitis compared to sham operated animals. Representative profiles of CD68 and F4/80 expressing cells in the R1 population of sham (D) and ligated (E) mice after 24 h are shown. A significant enrichment in the total number of R1 gated CD68+ F4/80− cells in the right lung 9 h (F) and 24 h (G) after pancreatitis induction compared to sham controls. CD68+ cells were increased significantly in the immunohistochemical staining of the lung sections in the acute pancreatitis compared to sham at 9, 24 and 48 h. , n = 8 per group. *P<0.05, **P<0.01, ***P<0.001 versus control, by two-tailed Student t-test.

