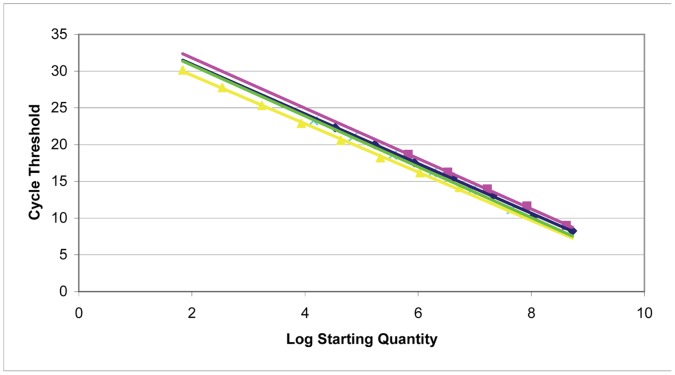
Figure 2. Standard curve used to quantify plasmid copy number in E. coli.
Plasmid standard curves were generated using known amounts of plasmid DNA. The linear dynamic range was determined to be from 5.37×10⁶ to 69 copies of genomic DNA (yellow), 4.40×10⁷ to 1.41×10⁴ copies of pSAM (green), 4.18×10⁸ to 6.69×10⁵ copies of pACYC (pink), and 5.32×10⁸ to 3.41×10⁴ copies of pGEX-6p-1 (blue). Regression analysis displayed R 2 values of 0.999 for pSAM, 0.998 for pGEX-6p-1, 0.998 for pACYCDuet, and 0.999 for genomic DNA.

