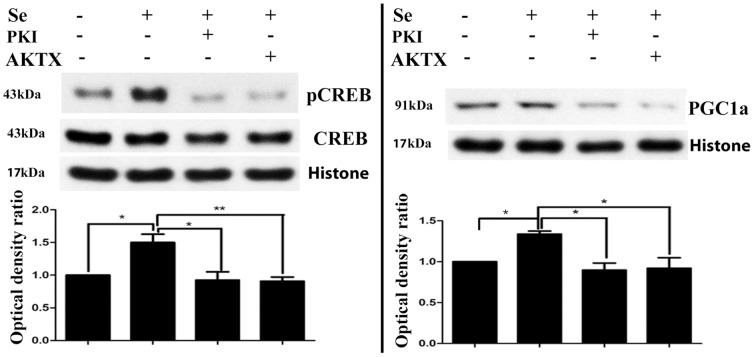
Figure 4. Effects of PKI and AKTX on Se-induced phospho-CREB and PGC-1α.
Cells were treated with 100 nM Se. PKA inhibitor 14–22 amide or AKT inhibitor X (AKTX, 5 µM) were added to medium in the presence of Se. Western blotting was performed after 5 h of incubation. Upper panel, representative Western blot bands. Lower panel, summarized bar graphs show band intensity presented as ratio of targeting protein over Histone H3. Values are means±s.d. * p<0.05 and **p<0.01 by ANOVA followed by Tukey's test.

