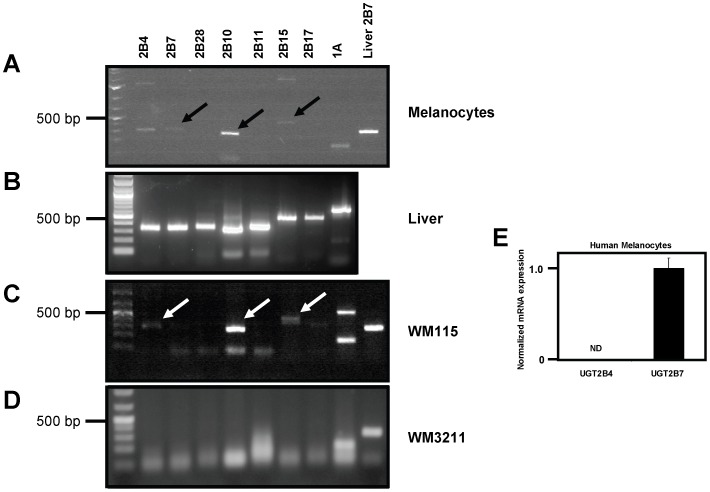
Figure 1. UGT mRNA expression in primary human melanocytes and melanoma.
(A) RT-PCR analysis of total RNA from human melanocytes for UGT family members. Primer sets for the UGT2Bs were designed to be specific to each isoform while a single primer set directed against the common region of all UGT1As was used to detect UGT1A expression. Total RNA from human liver was used as a control with UGT2B7 primers. Arrows indicate DNA bands of expected size whose sequence was confirmed. (B) Control RT-PCR analysis of total RNA from liver using indicated primers sets. (C) RT-PCR analysis of total RNA from the human melanoma cell line WM115 using indicated primers sets. Arrows indicate bands that were excised and sequenced. Band in UGT2B4 lane was found to be UGT2B7 by sequencing while UGT2B10 and UGT2B15 bands were confirmed to be expected UGTs. (D) RT-PCR analysis of total RNA from the human melanoma cell line WM3211. GAPDH was used as a positive control here to ensure cDNA quality. (E) Real-time PCR using TaqMan assays against indicated UGTs. ND = not detected.

