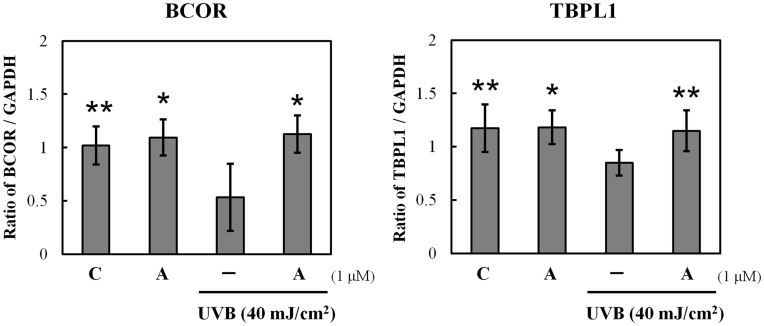
Figure 6. Verification of microarray results by qPCR assay.
Cells exposed to alkannin or UVB light (40 mJ/cm2) or both were used for real-time qPCR assay of the selected genes BCOR and TBPL1. Each mRNA expression level was normalized with GADPH. Data are presented as mean ± SD (n = 3). *p<0.005, **p<0.05.

