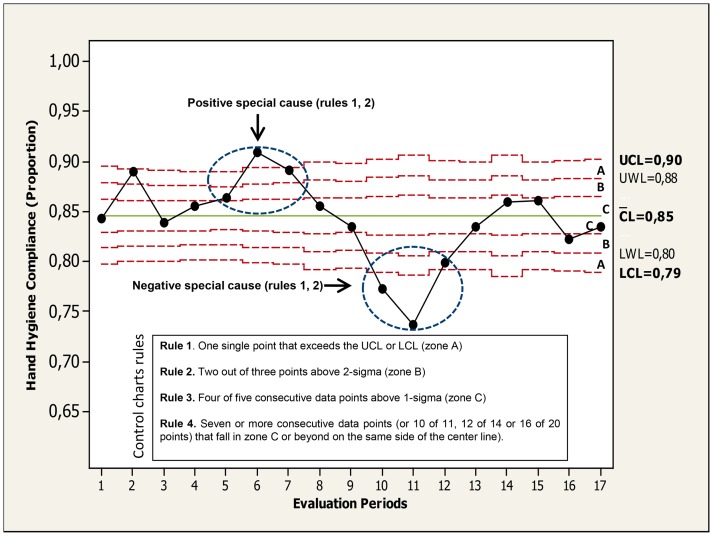
Figure 1. Binomial control chart (statistical overall hand hygiene compliance process control during phase 2).
Audits were conducted during three randomized days every three weeks accounting for 17 evaluation periods on 2011. Two set of points are highlighted (circles) and the rules (“special causes”) are shown. Three zones (C, B, A) that emanate outward from the center line (CL) are labeled (often referred as “sigma limits”): zone C (from CL to +/− 1σ limit); zone B (from +/−1σ to +/− 2σ, whose limits are also known as “warning limits” [WL]), and zone A (from +/− 2σ to +/− 3σ [Upper control limit (UCL) and lower control limit (LCL) respectively].

