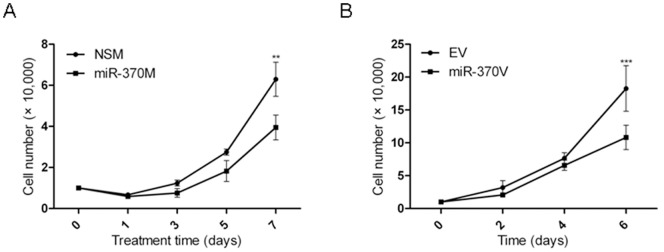
Figure 6. miR-370 induces growth retardation.
A. HuCCT1 malignant cholangiocytes display decreased growth upon reinforcement of miR-370 expression. X-axis – HuCCT1 cells counted at day 1, 3, 5 and 7 after transfection with miR-370M, or NSM, respectively. Y-axis – cell counts ×104 of HuCCT1 cells transfected with miR-370 mimic (miR-370M, black squares) or NSM (black circles). B. HuCCT1 malignant cholangiocytes display decreased growth upon modest miR-370 upregulation through infection with MIEG3-miR-370. X-axis – HuCCT1 cells counted at days 2, 4 and 6 after plating of MIEG3-miR-370 (miR-370V) HuCCT1 cells or MIEG3-EV (EV) HuCCT1 cells, respectively. Y-axis – cell counts ×104 of miR-370V HuCCT1 cells (black circles) or the EV HuCCT1 cells (black squares). For every treatment and every time point, the data presented is the average of 5 independently counted wells. Mean ± SD, **P<0.01, ***P<0.001.

