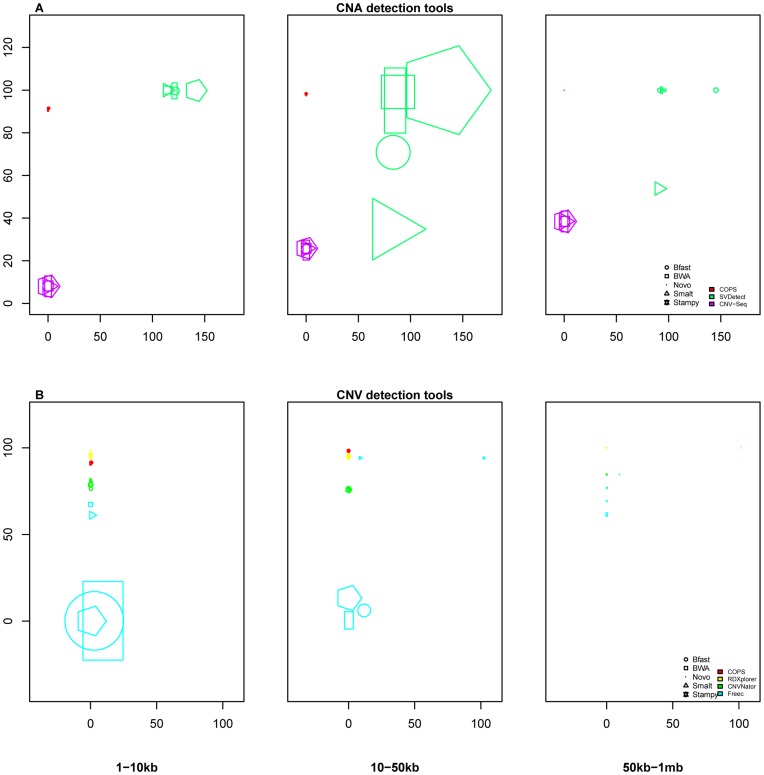
Figure 7. Performance comparisons across short read aligners.
Shown are the performances of SCNA (A) and CNV (B) detection tools using 76 nt reads againsttest:ref pairs simulating 1–10 kb, 10–50 kb and 50 kb–1 mb long SCNAs covering 1.50% of chr1, using five aligners. Each plot graphs the false positives (x axes) against the true positives (y axes). The size of the data point indicates the deviation in size of the detected SCNA from the simulated SCNA, the shape indicates the upstream aligner (Text S2) and the color indicates the SCNA/CNV detection tool used in the respective analyses.

