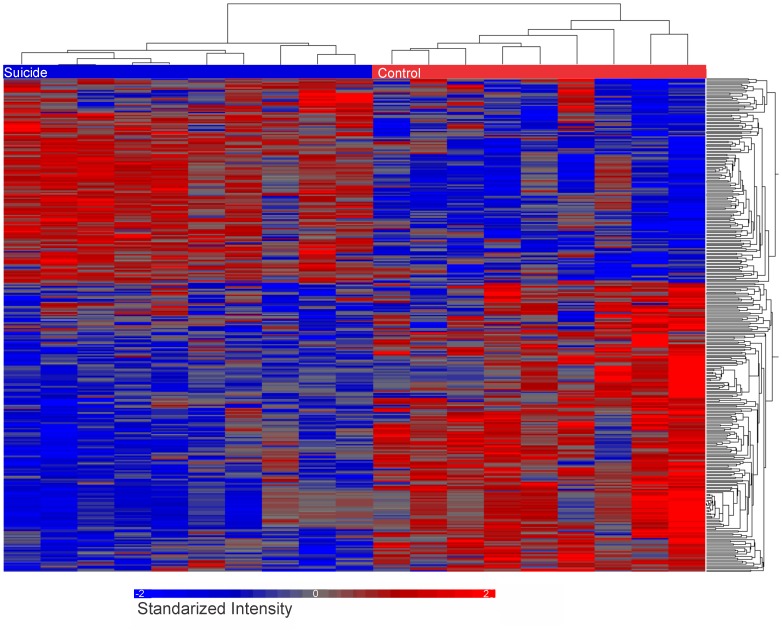
Figure 2. Heat Map and dendrogram of all Control and depressed/suicide samples show both up and down-regulation and clustering of 238 differentially expressed genes.
Relative Expression values were normalized across all samples within each data set. Rows represent probes while columns represent individual samples. Grey bars indicate no difference in expression, whereas blue and red indicate more and less expression, respectively.

