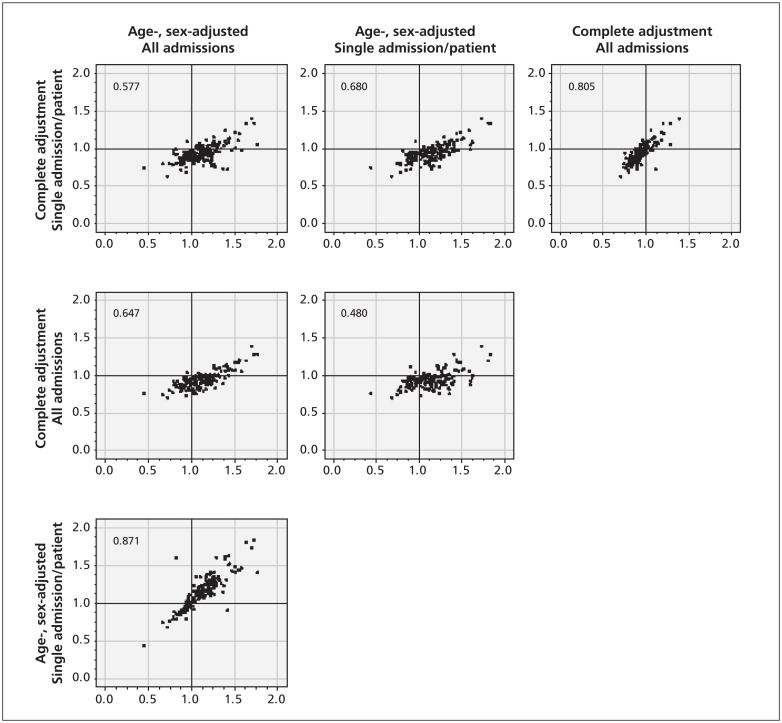
Figure 1:
Comparison of values for observed-to-expected ratios for death or urgent readmission within 30 days determined for 162 hospitals using 4 different methods of calculation. The Spearman correlation coefficient is presented in the top left corner of each plot. The panels are aligned as rows and columns by categories.

