
Figure 2.
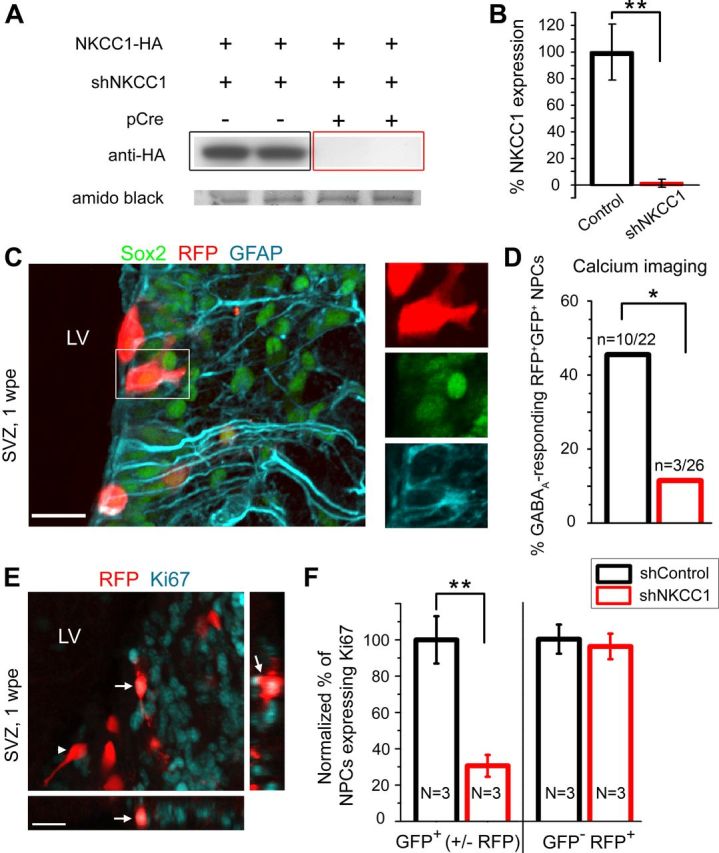
NKCC1 knockdown curtails NPC proliferation resulting in reduced neuron production. A, Western blot of NKCC1 knockdown in Neuro-2a cells transfected with HA-tagged NKCC1 overexpressor and shNKCC1 with or without pCre. Amido black staining verifies equivalent amounts of protein loaded in each condition. B, Quantification of NKCC1-HA expression in Neuro-2a cells following knockdown with shNKCC1. C, Confocal images of the SVZ at 1 wpe, including cells expressing a stem cell marker Sox2 (pseudo-colored green), RFP (red) and GFAP (blue) immunostaining. Box indicates the RFP+ Sox2+ GFAP+ cell magnified on the right. D, Quantification of muscimol-responding RFP+ NPCs at 1 wpe electroporated with shControl (black) or shNKCC1 (red). E, Confocal images of RFP (red) and cell division marker Ki67 (blue) immunostaining in the SVZ at 1 wpe. Arrows: RFP+ Ki67+ cell, also displayed in projections; arrowhead: RFP+ cell that is not Ki67+. F, Quantifications of RFP+ GFP+ NPCs and RFP+ GFP− (internal control) NPCs expressing Ki67+ with shControl (black) or shNKCC1 (red). *p ≤ 0.05, **p < 0.01. Scale bars: C and E, 20 μm.