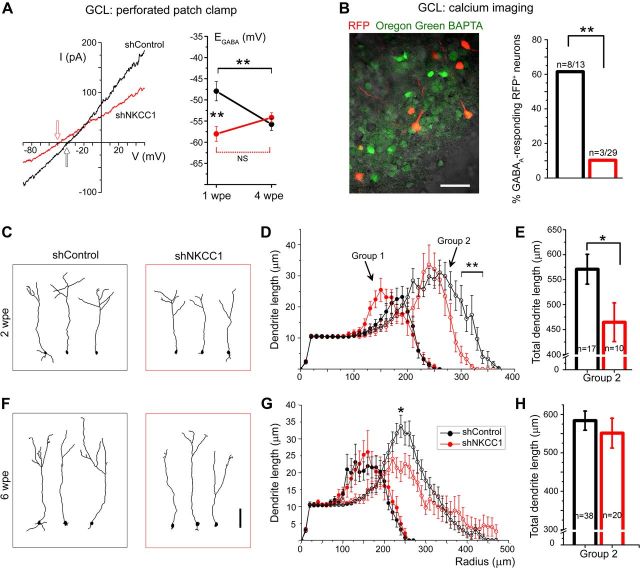
Figure 4.
GABAA depolarizing activity promotes dendritogenesis of newborn neurons. A, Left, Representative current (I)-voltage (V) curves of 5 μm muscimol-induced currents in shNKCC1 (red) and shControl (black) GCL neurons at 1 wpe. Arrows indicate EGABA, the means of which are plotted on the right at 1 wpe (n = 6 shNKCC1 and 20 shControl cells) and 4 wpe (n = 7 and 10). NS, Not significant. B, Left, Images of RFP+ (red) and calcium dye Oregon Green BAPTA-loaded (green) neurons in the GCL at 2 wpe. Right, Significantly fewer shNKCC1 neurons exhibit calcium responses to muscimol compared with shControl, indicating decreased GABAA-induced depolarization in shNKCC1 neurons. C, D, F, G, Representative reconstructions of Group 2 shNKCC1 and shControl neurons at 2 (C) and 6 (F) wpe and corresponding plots of the summed dendrite length (D, G). E, H, Graphs of total dendritic length of Group 2 neurons with shControl (black) and shNKCC1 (red) at 2 (D) and 6 (G) wpe. A break was inserted in the y-axis. n, number of cells analyzed. *p ≤ 0.05, **p < 0.01. Scale bars: B, 60 μm; C, F, 100 μm.

