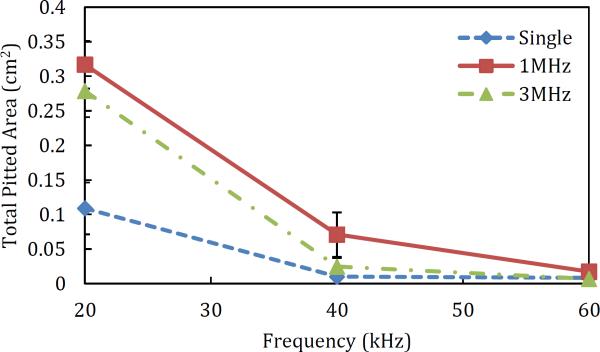
Figure 5.
Variation of the total pitted area in the aluminum foil pitting experiments as a function of the low- and high-frequency US used. All the experiments were carried out using a coupling solution of 1% SLS, and the low-frequency US was pulsed (1s on, 1s off). The red, green, and blue lines are drawn to facilitate observation of trends. Error bars represent one standard deviation.

