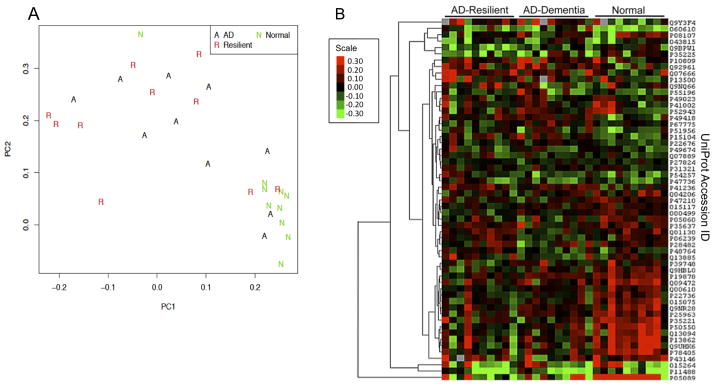
Figure 2.
Antibody Microarray Analyses. A) Plot of principal components analysis applied to the antibody microarray full data set generated using the first (PC1) and second (PC2) components. Normal Comparison (N) cases clustered distinctly from AD-Dementia (A) and AD-Resilient (R) groups. Both AD-Resilient and AD-Dementia groups were more mixed and showed a more dispersed pattern on the plot. B) Heat map generated using 57 proteins differentially expressed in any of the three groups compared to the others (selected by one-way ANOVA, p-value ≤ 0.01). Hierarchical clustering was applied to the proteins to help visualize the differences. Euclidean distance and complete linkage were used when computing hierarchical clustering of proteins. Five missing values on the heat map are colored in dark gray. Color scale indicates ordinally induced log2 expression levels of proteins.

