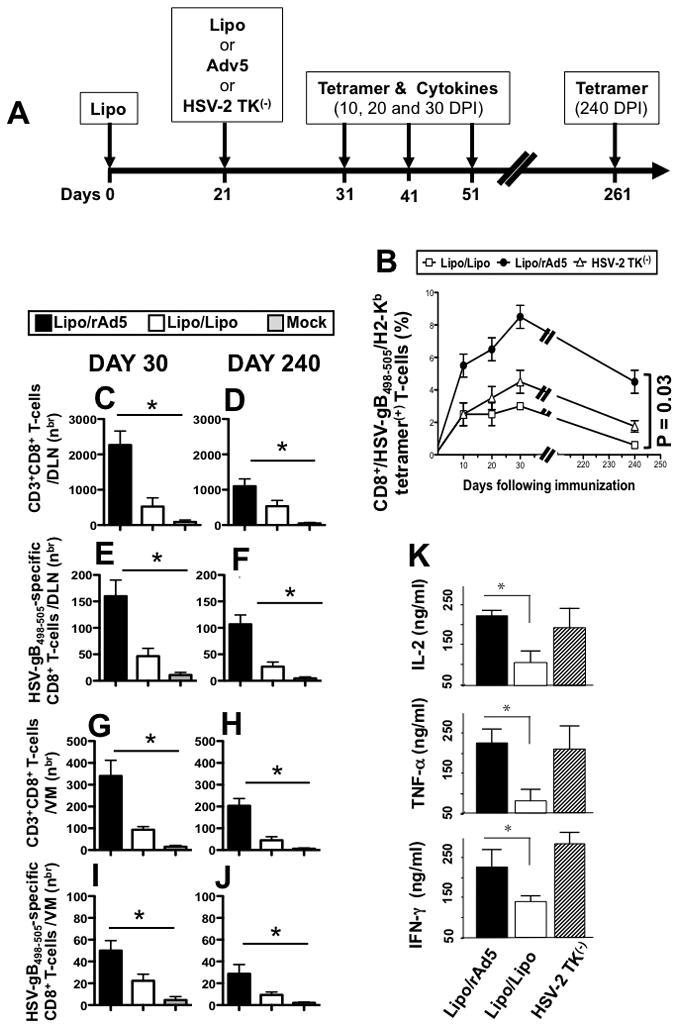
Figure 3. Higher percentages and increased numbers of HSV-gB498-505-specific CD8+ T-cells induced by the Lipo/rAdv5 prime/boost compared to its Lipo/Lipo homologous mucosal vaccine.

(A) Groups of female B6 mice (n =40) were immunized IVAG, with lipopeptide on day 0 and 5 × 10⁷ pfu of rAd5 in saline on days 21 (Lipo/rAdv5 prime/boost mucosal vaccine or Lipo/rAd5, with 100 μg of lipopeptide in saline on days 0 and 21 (homologous Lipo/Lipo vaccine or Lipo/Lipo), or with the live attenuated HSV-2 TK(−) on day 21, as we previously described (6) (positive control). (B) On day 10, 20 30 and 240 post-immunization, GT-DLN were harvested (5 mice per each time point) and derived T cells were stimulated in vitro with UV-inactivated virus pulsed APCs for 5 days. Stimulated HSV-gB498-505- specific CD8+ T-cells were then stained with a PE-labeled anti-mouse CD8+ mAb followed by either an FITC labeled HSV-gB498-505/H2-Kb tetramer. Cells were then analyzed using a FACS Calibur with a total of 2 ×10⁵ events collected for each point. The percentages of CD8+/Tetramer+ cells are determined for each time point. Shown is mean ± SD of the results obtained in 5 mice/group. Each bar is representative of the mean ± standard error of results from 5 mice. Data for each group were repeated twice and compared by analysis of variance (ANOVA test) and multiple comparison procedures (Tukey) to determine differences between groups, as we previously described (6). P value of 0.03 indicates significant differences between Lipo/Lipo and Lipo/rAd5 immunized groups (one-way ANOVA test). (C–D) Numbers of total CD3+CD8+ T cells and (E–F) HSV-gB498-505-specific CD8+ T cells detected in the GT-DLN on days 30 and 240 DPI. (G–H) Numbers of total CD3+CD8+ T cells and (I–J) HSV-gB498-505-specific CD8+ T cells detected in the VM on days 30 and 240 DPI. (K) Profile of HSV-gB498-505-specific cytokine produced by CD8+ T-cells following Lipo/Lipo and Lipo/rAd5 immunizations. GT-DLN were harvested 30 days after the second immunization and GT-DLN-derived CD8+ T-cells were stimulated in vitro with target gB498-505 peptide loaded H2b irradiated splenocytes for 72 days at γ, TNF-α and IL-2 secreted into the culture media were 37°C in 5% CO2. The amounts of IFN-determined in a specific sandwich ELISA, according to the manufacturer’s instructions. Shown is cytotoxic activity and profiles obtained in a group of 5 mice. The data are representative of two independent experiments and the bars represent SD between the experiments. The (*) indicate p values < 0.05 using one-way ANOVA test when comparing the amount of cytokine levels between Lipo/Lipo and Lipo/rAd5 groups.
