
Figure 5.
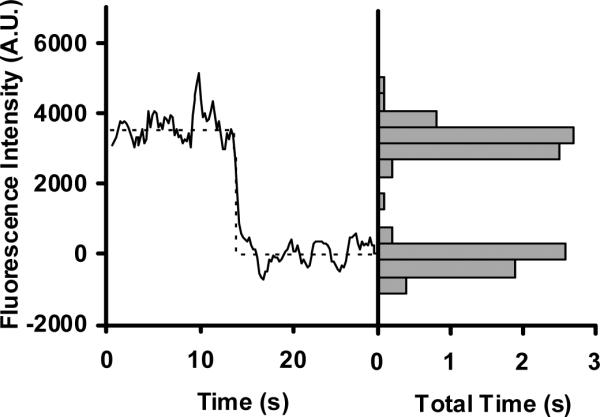
A representative time trace and intensity distribution for the Cy3 intensity of a single NP-immobilized oligonucleotide. The single-step decrease in intensity corresponds to the photobleaching of a single Cy3 dye. The histogram on the right shows the total time distribution of the intensities from the trace. The number of instances for each intensity bin was converted to total time by multiplying the number of instances by the frame capture time (100 ms). Two well-separated populations that correspond to the fluorescent and photobleached states are observed. The fluorescence intensity is shown in arbitrary units (A.U.).