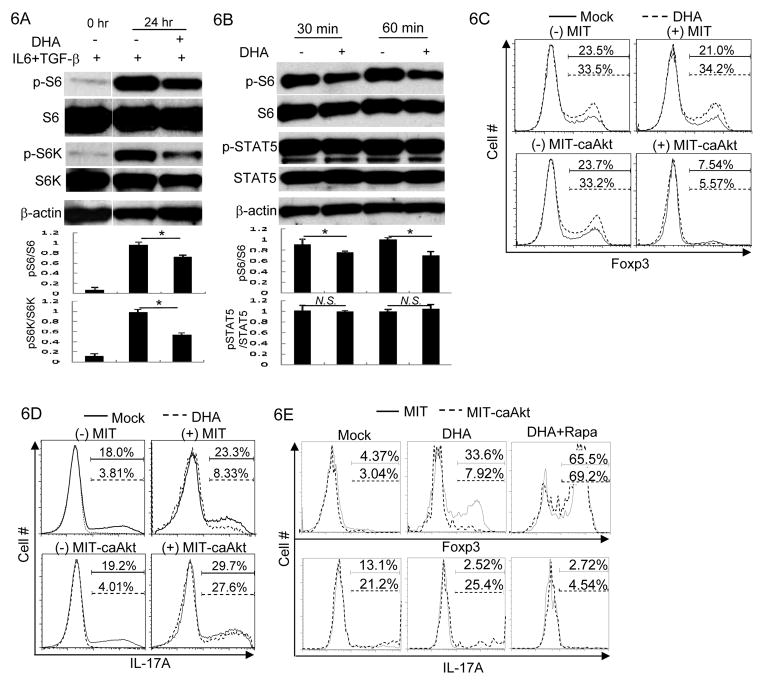
Figure 6. DHA regulated T cell function by modulating mTOR pathway.
6A. CD4+ T cells were activated under Th17 cell polarizing conditions for indicated time with the treatment of DHA (+) or Mock (−). The protein amounts of phosphorylated S6 (p-S6), S6, phosphorylated p70 S6 kinase (p-S6K), S6K and β-actin were determined by immunoblotting. Results are representative of at least three experiments. Densitometry analysis of immuno-blotting was also shown. (*P<0.05)
6B. Effector CD4+ T cells were stimulated in the presence of 5ng/ml IL-2 for indicated time with the treatment of DHA (+) or Mock (−). The protein amounts of phosphorylated S6 (p-S6), S6, phosphorylated STAT5 (p-STAT5), STAT5 and β-actin were assessed by immunoblotting. Results are representative of at least three experiments. Densitometry analysis of immuno-blotting was also shown. (N.S. Not Significant; *P<0.05)
6C. CD4+ T cells were activated and then transduced with control recombinant virus MSCV-IRES-thy1.1 (MIT) or with recombinant virus expressing a constitutive active form of Akt (MIT-caAkt) in the presence of 1ng/ml of TGF-β under the treatment of DHA (dashed line) or Mock (solid line). Foxp3 expression in transduced (+) or un-transduced (−) cells were assessed by intracellular staining and flow-cytometric analysis. The percentages of Foxp3+ Treg cells were indicated above the brackets. Results are representative of three experiments.
6D. CD4+ T cells were activated and then transduced with control recombinant virus MSCV-IRES-thy1.1 (MIT) or with recombinant virus expressing a constitutive active form of Akt (MIT-caAkt) under Th17 cell polarizing conditions with DHA (dashed line) or Mock (solid line) treatment. IL-17A expression in transduced (+) or un-transduced (−) cells were assessed by intracellular staining and flow-cytometric analysis. The percentages of IL-17A+ cells were indicated above the brackets. Results are representative of three experiments.
6E. CD4+ T cells were activated under Th17 cell polarizing conditions with the treatment of Mock, DHA or DHA plus Rapamycin (DHA+Rapa). Cells were transduced with control recombinant virus MSCV-IRES-thy1.1 (MIT, solid line) or with recombinant virus expressing a constitutive active form of Akt (MIT-caAkt, dashed line). Foxp3 and IL-17A expression in transduced cells were assessed by intracellular staining and flow-cytometry analysis. The percentages of Foxp3+ and IL-17A+ cells among transduced T cells are shown above the brackets. Results are representative of three experiments.

