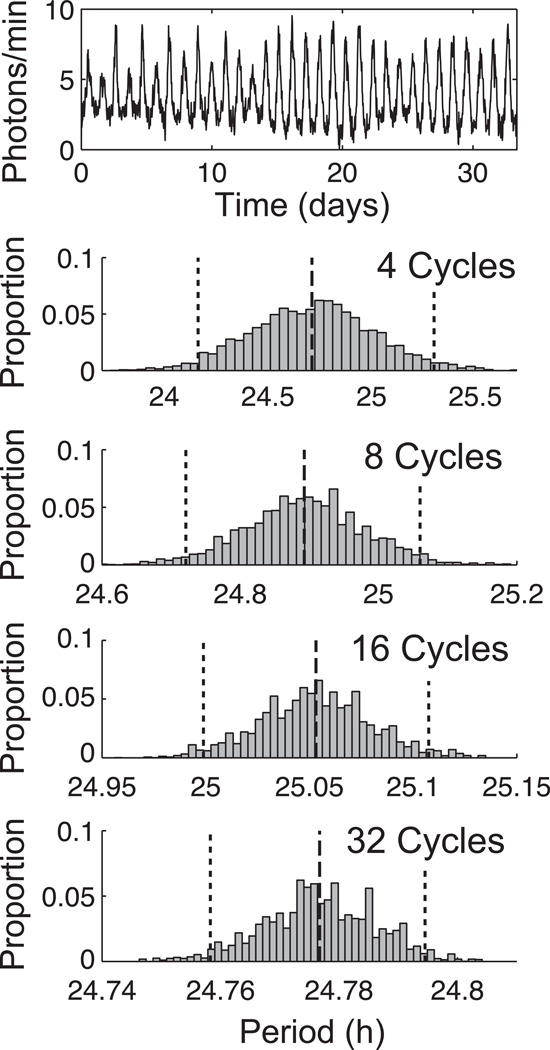
Figure 3.
Application of the BPENS period estimation method to Fibroblast #57, whose time series is shown at the top, using 4, 8, 16, or 32 cycles. Each histogram displays the computed posterior distribution for the period, with 95% CIs indicated by dotted lines and the mean value by a dashed line. The width of the CIs reflects the uncertainty of the period estimate. Note that as the number of cycles increases, the range of the horizontal axis greatly decreases.

