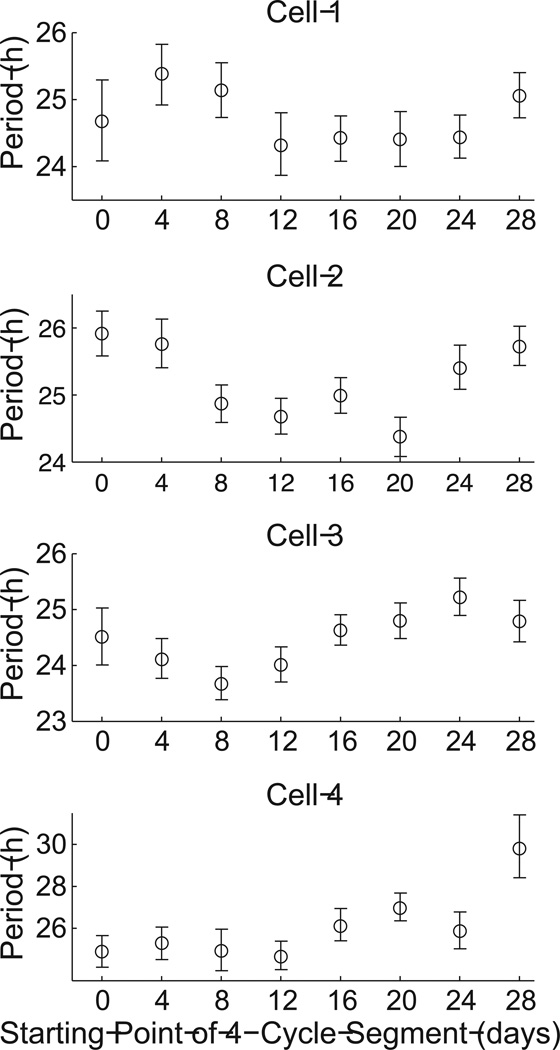
Figure 5.
Estimated period for 4-cycle segments of four fibroblast time series starting at different time points, revealing variability in estimated period over time. Cells 1–4 are Fibroblasts #57, #25, #44, and #65, respectively (Leise et al., 2012). Error bars show 95% CIs and the mean is marked with a circle.

