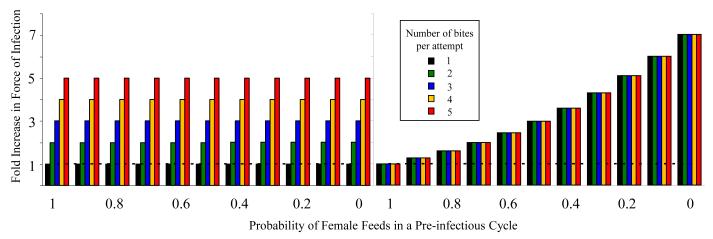
Figure 1. The effect of manipulation on transmission.
The effect of increased number of bites per attempt (different colored bars) and the probability that a female feeds in a pre-infectious cycle (x-axis) on the force of malaria infection. For the left panel, daily mortality is assumed to be the most important source of mortality; in the right panel, mortality is assumed to be almost entirely feeding-associated. The dashed line indicates force of infection for unmanipulated females that always feed during the pre-infectious cycle and bite one person per feeding attempt. These two mortality extremes illustrate the interactions between mortality distribution and manipulation phenotypes. When mortality is evenly distributed through the feeding cycle and not associated with the feeding event, the biggest increase in force of infection comes from the number of bites per attempt (the differences between different colored bars). When mortality is attributed to feeding, the biggest increases in relative force of infection are mediated by the decreased mortality experienced by females in the oocyst-stage.

